
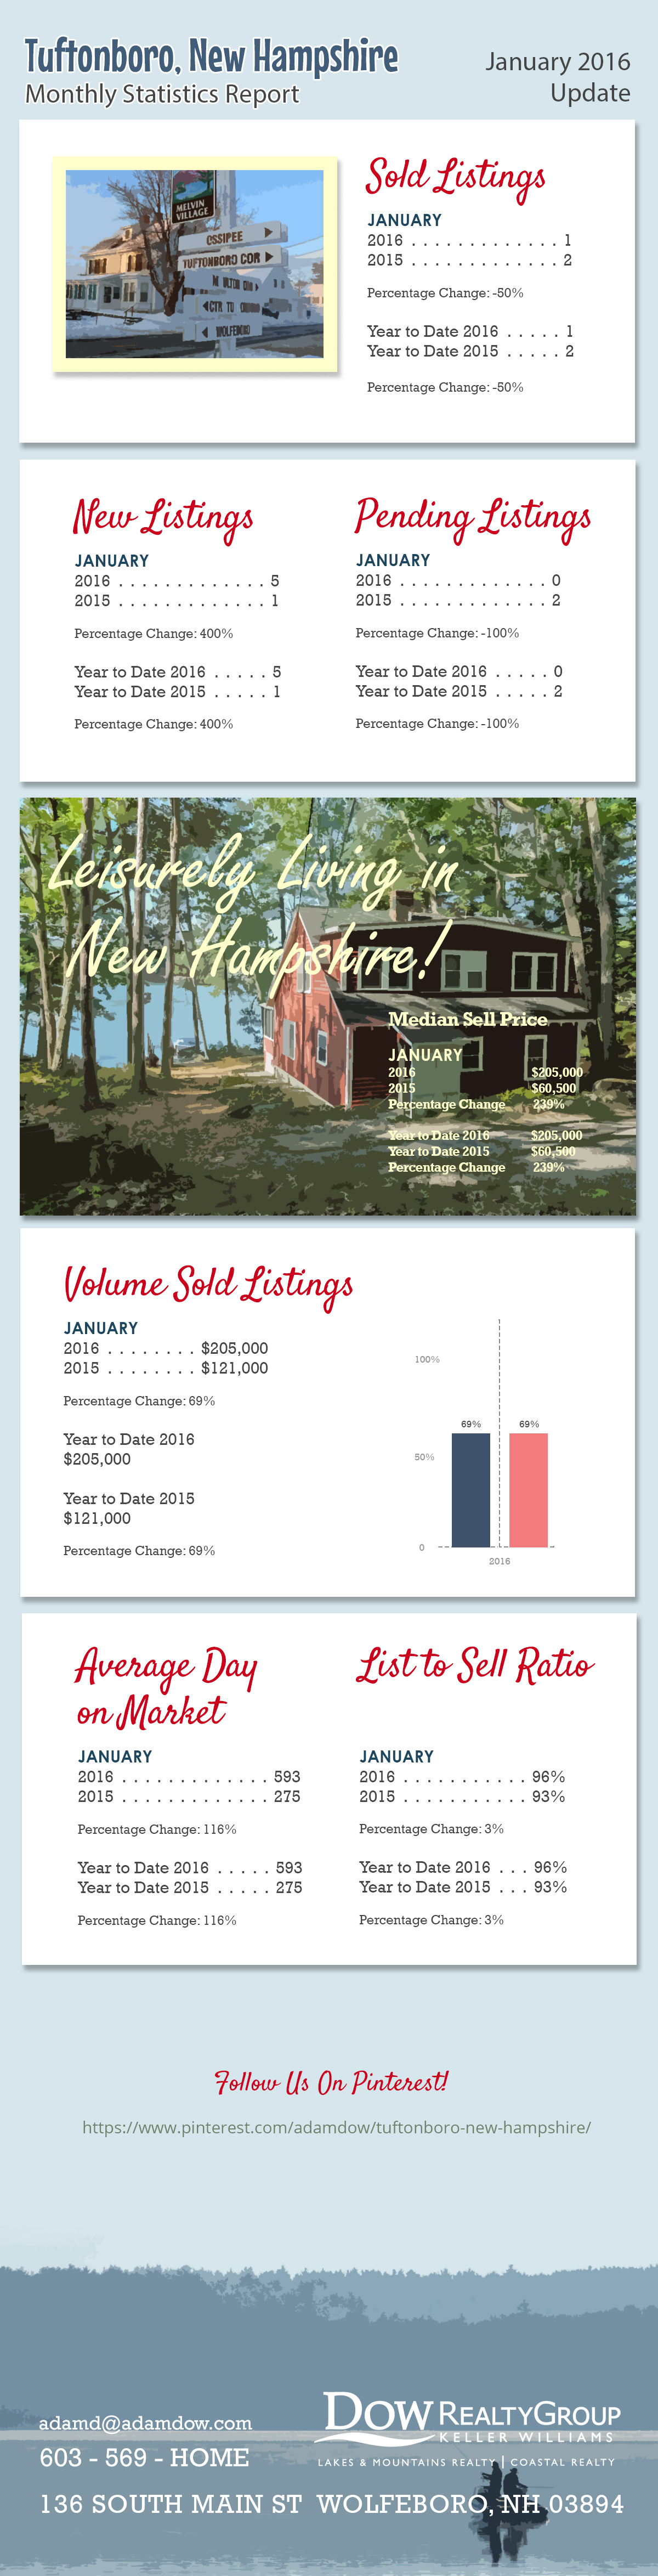
The following is the monthly statistics report for the town of Tuftonboro as of January 2016.
Raw Data from MLS:
| MONTHLY STATISTICS REPORT - 01/01/2016 - 01/31/2016 | ||||
| Northern New England Real Estate Network - Compiled on February 4, 2016 | TUFTONBORO | |||
| Change from | Change from | |||
| 01/01/2016 - 01/31/2016 | 12/01/2015 - 12/31/2015 | 01/01/2015 - 01/31/2015 | 01/01/2015 - 01/31/2015 to | |
| 01/01/2016 - 01/31/2016 | ||||
| Res/Condo/Mfd/Mobile | ||||
| New Listings | 5 | 0 | 1 | 400% |
| Sold Listings | 1 | -80% | 2 | -50% |
| Pending Listings | 0 | -100% | 2 | -100% |
| Vol. Sold Listings | $205,000.00 | -85.28% | $121,000.00 | 69.42% |
| Avg. Sell Price | $205,000.00 | -26.41% | $60,500.00 | 238.84% |
| Median List Price | $214,000.00 | -6.91% | $64,900.00 | 229.73% |
| Median Sell Price | $205,000.00 | -2.38% | $60,500.00 | 238.84% |
| List to Sell Ratio | 95.79% | 7.47% | 93.22% | 2.76% |
| Avg. Day on Market | 593 | 203.79% | 275 | 116.02% |
| YTD | YTD | 2015 - 2016 | ||
| 2016 | 2015 | YTD | ||
| 5 | 1 | 400% | ||
| 1 | 2 | -50% | ||
| 0 | 2 | -100% | ||
| $205,000.00 | $121,000.00 | 69.42% | ||
| $205,000.00 | $60,500.00 | 238.84% | ||
| $214,000.00 | $64,900.00 | 229.73% | ||
| $205,000.00 | $60,500.00 | 238.84% | ||
| 95.79% | 93.22% | 2.76% | ||
| 593 | 275 | 116.02% |
Listing link to the properties in Tuftonboro:
http://www.adamdow.com/just-listed/just-listed-tuftonboro/
Pinterest link:
.webp)


Social Media Links