
The following is the monthly statistics report for the town of Gilford as of January 2016.
Raw Data from MLS:
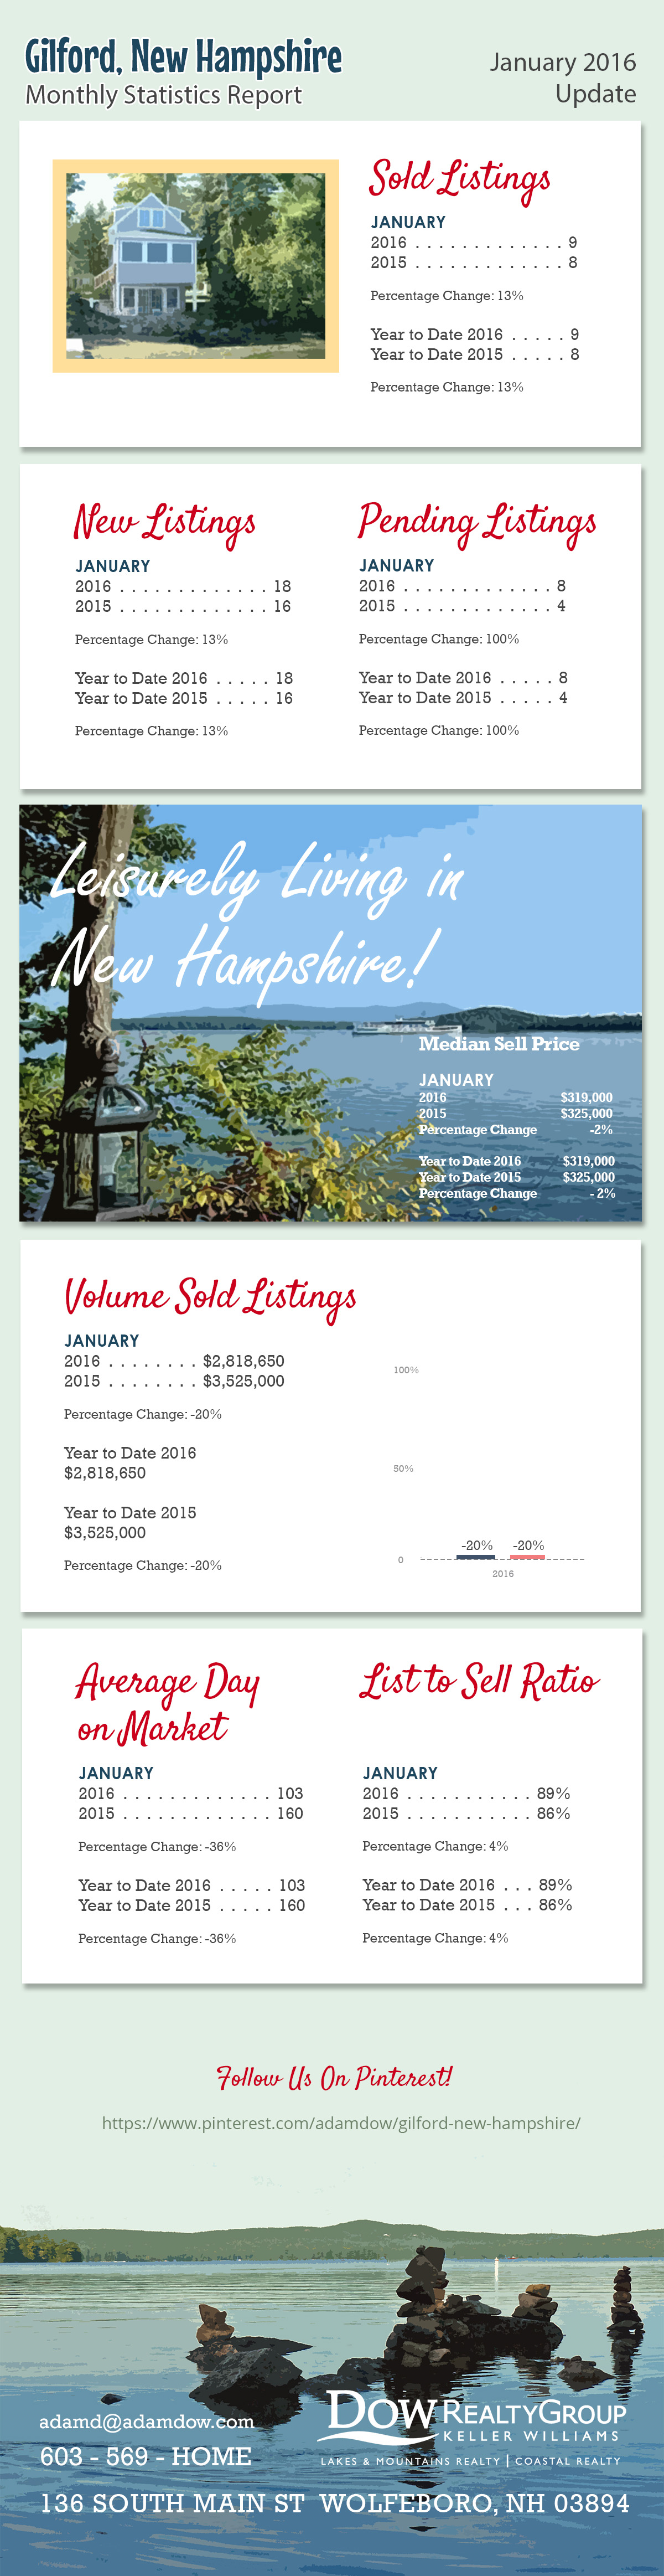
| MONTHLY STATISTICS REPORT - 01/01/2016 - 01/31/2016 | ||||
| Northern New England Real Estate Network - Compiled on February 4, 2016 | GILFORD | |||
| Change from | Change from | |||
| 01/01/2016 - 01/31/2016 | 12/01/2015 - 12/31/2015 | 01/01/2015 - 01/31/2015 | 01/01/2015 - 01/31/2015 to | |
| 01/01/2016 - 01/31/2016 | ||||
| Res/Condo/Mfd/Mobile | ||||
| New Listings | 18 | 63.63% | 16 | 12.50% |
| Sold Listings | 9 | -10% | 8 | 12.50% |
| Pending Listings | 8 | 100% | 4 | 100% |
| Vol. Sold Listings | $2,818,650.00 | -57.03% | $3,525,000.00 | -20.03% |
| Avg. Sell Price | $313,183.33 | -52.26% | $440,625.00 | -28.92% |
| Median List Price | $329,000.00 | 20.75% | $348,900.00 | -5.70% |
| Median Sell Price | $319,000.00 | 19.47% | $325,000.00 | -1.84% |
| List to Sell Ratio | 89.48% | -3.98% | 85.96% | 4.09% |
| Avg. Day on Market | 103 | 61.86% | 160 | -35.55% |
| YTD | YTD | 2015 - 2016 | ||
| 2016 | 2015 | YTD | ||
| 18 | 16 | 12.50% | ||
| 9 | 8 | 12.50% | ||
| 8 | 4 | 100% | ||
| $2,818,650.00 | $3,525,000.00 | -20.03% | ||
| $313,183.33 | $440,625.00 | -28.92% | ||
| $329,000.00 | $348,900.00 | -5.70% | ||
| $319,000.00 | $325,000.00 | -1.84% | ||
| 89.48% | 85.96% | 4.09% | ||
| 103 | 160 | -35.55% | ||
Listing link to the properties in Gilford:
http://www.adamdow.com/gilford/just-listed-wolfeboro/
Pinterest link:
https://www.pinterest.com/adamdow/gilford-new-hampshire/
.webp)


Social Media Links