
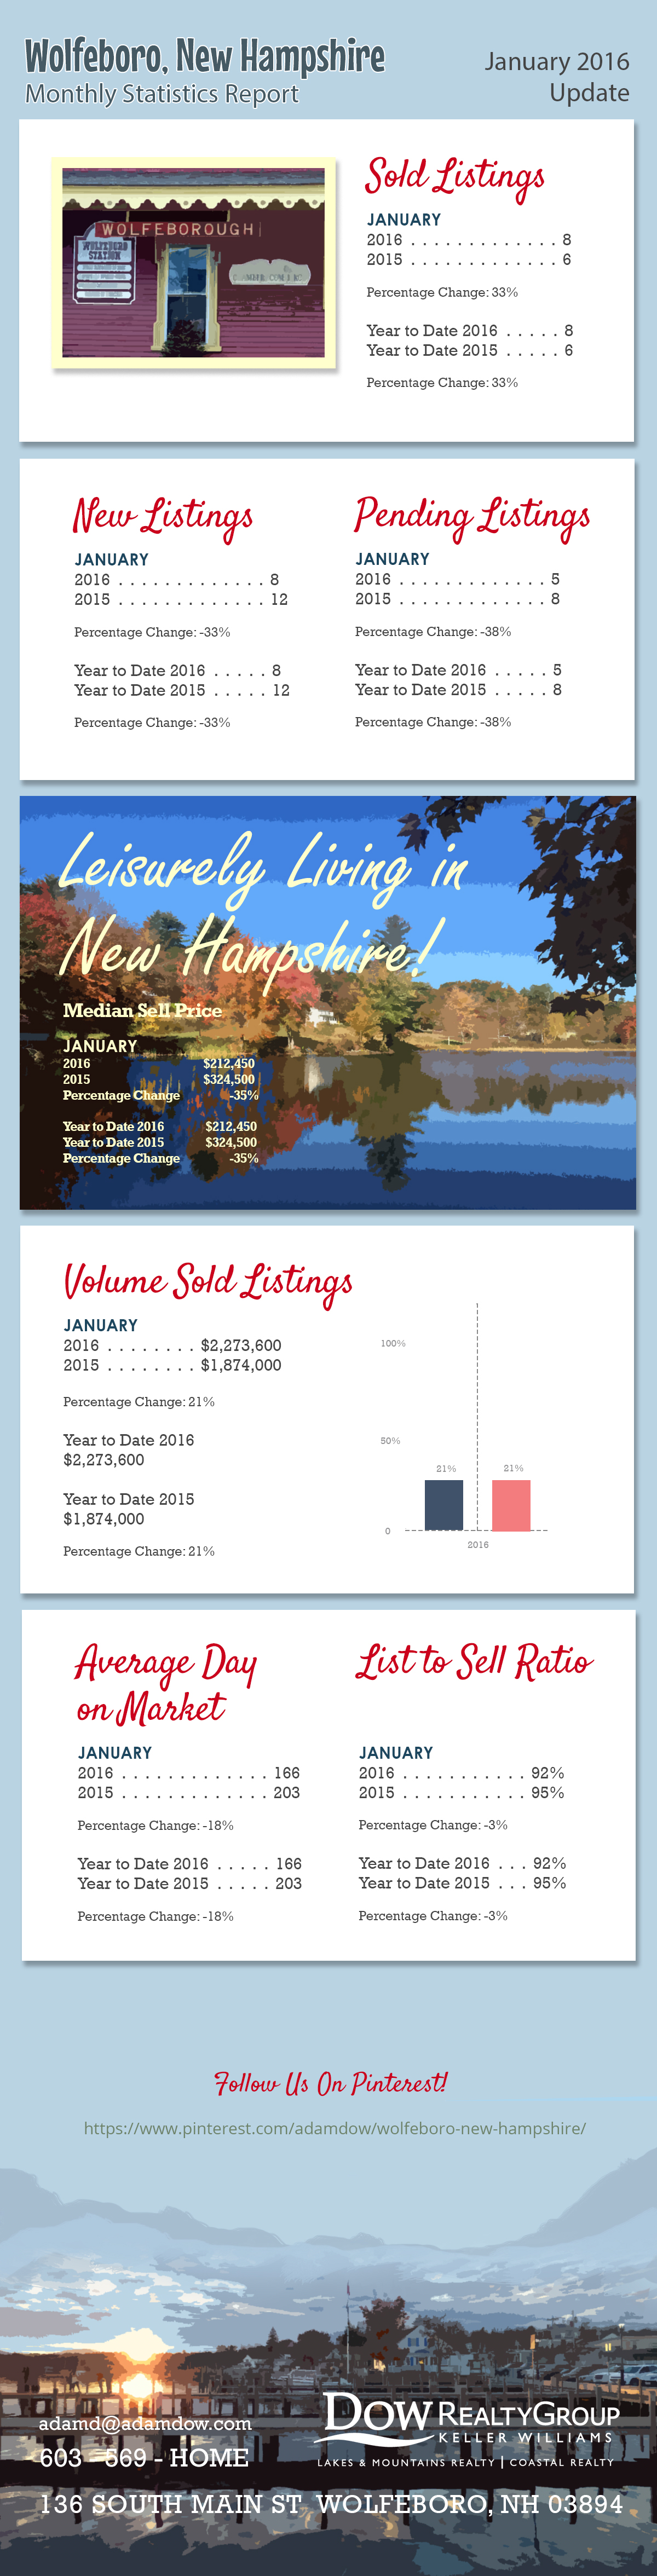
The following is the monthly statistics report for the town of Wolfeboro as of January 2016.
Raw Data from MLS:
| MONTHLY STATISTICS REPORT - 01/01/2016 - 01/31/2016 | ||||
| Northern New England Real Estate Network - Compiled on February 4, 2016 | ||||
| WOLFEBORO | ||||
| Change from | Change from | |||
| 01/01/2016 - 01/31/2016 | 12/01/2015 - 12/31/2015 | 01/01/2015 - 01/31/2015 | 01/01/2015 - 01/31/2015 to | |
| 01/01/2016 - 01/31/2016 | ||||
| Res/Condo/Mfd/Mobile | ||||
| New Listings | 8 | -11.11% | 12 | -33.33% |
| Sold Listings | 8 | -38.46% | 6 | 33.33% |
| Pending Listings | 5 | 25% | 8 | -37.50% |
| Vol. Sold Listings | $2,273,600.00 | -71.72% | $1,874,000.00 | 21.32% |
| Avg. Sell Price | $284,200.00 | -54.05% | $312,333.33 | -9.00% |
| Median List Price | $214,900.00 | -46.26% | $331,400.00 | -35.15% |
| Median Sell Price | $212,450.00 | -47.80% | $324,500.00 | -34.53% |
| List to Sell Ratio | 91.94% | 1.21% | 95.13% | -3.35% |
| Avg. Day on Market | 166 | 71.12% | 203 | -17.96% |
| YTD | YTD | 2015 - 2016 | ||
| 2016 | 2015 | YTD | ||
| 8 | 12 | -33.33% | ||
| 8 | 6 | 33.33% | ||
| 5 | 8 | -37.50% | ||
| $2,273,600.00 | $1,874,000.00 | 21.32% | ||
| $284,200.00 | $312,333.33 | -9.00% | ||
| $214,900.00 | $331,400.00 | -35.15% | ||
| $212,450.00 | $324,500.00 | -34.53% | ||
| 91.94% | 95.13% | -3.35% | ||
| 166 | 203 | -17.96% | ||
Listing link to the properties in Wolfeboro:
http://www.adamdow.com/wolfeboro/just-listed-wolfeboro/
Pinterest link:
https://www.pinterest.com/adamdow/wolfeboro-new-hampshire/
.webp)


Social Media Links