
The following is the monthly statistics report for the town of Gilford as of February 2016.
Raw Data from MLS:
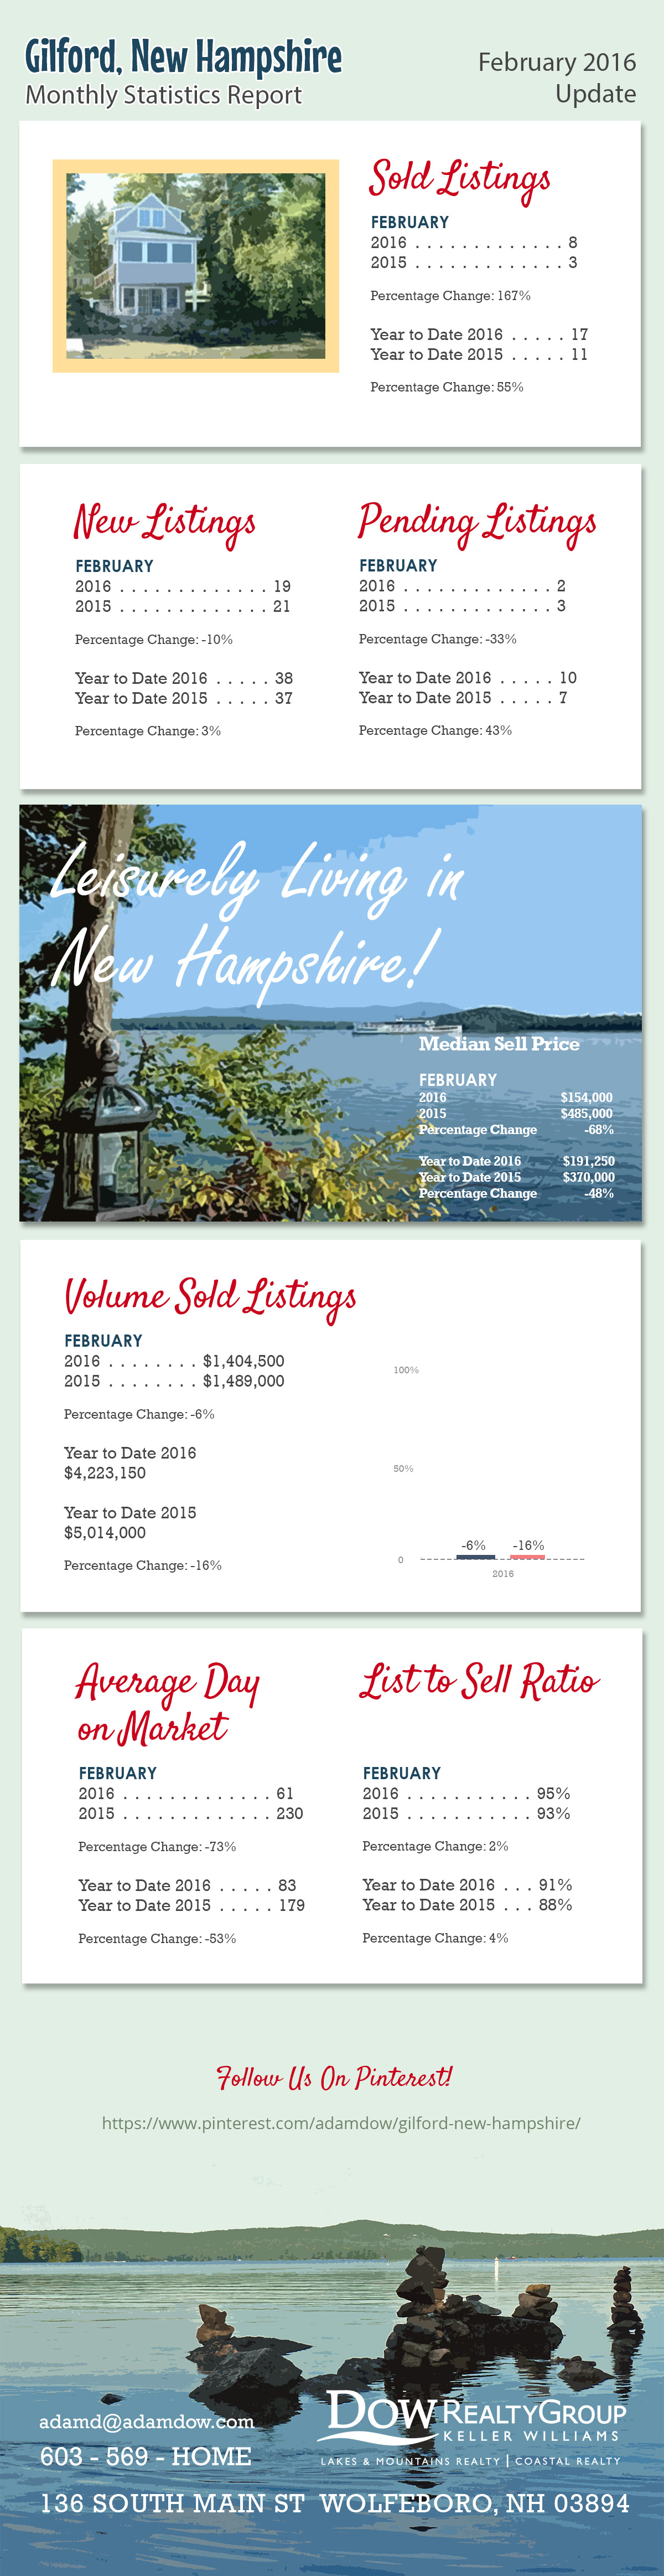
| MONTHLY STATISTICS REPORT - 02/01/2016 - 02/29/2016 | |||||
| Northern New England Real Estate Network - Compiled on March 3, 2016 | GILFORD | ||||
| Change from | Change from | ||||
| 02/01/2016 - 02/29/2016 | 01/03/2016 - 01/31/2016 | 02/01/2015 - 02/28/2015 | 02/01/2015 - 02/28/2015 to | ||
| 02/01/2016 - 02/29/2016 | |||||
| Res/Condo/Mfd/Mobile | |||||
| New Listings | 19 | 0 | 21 | -9.52% | |
| Sold Listings | 8 | -11.11% | 3 | 166.66% | |
| Pending Listings | 2 | -75% | 3 | -33.33% | |
| Vol. Sold Listings | $1,404,500.00 | -50.17% | $1,489,000.00 | -5.67% | |
| Avg. Sell Price | $175,562.50 | -43.94% | $496,333.33 | -64.62% | |
| Median List Price | $164,500.00 | -50% | $549,000.00 | -70.03% | |
| Median Sell Price | $154,000.00 | -51.72% | $485,000.00 | -68.24% | |
| List to Sell Ratio | 95.13% | 6.31% | 93.17% | 2.10% | |
| Avg. Day on Market | 61 | -40.59% | 230 | -73.36% | |
| YTD | YTD | 2015 - 2016 | |||
| 2016 | 2015 | YTD | |||
| 38 | 37 | 2.70% | |||
| 17 | 11 | 54.54% | |||
| 10 | 7 | 42.85% | |||
| $4,223,150.00 | $5,014,000.00 | -15.77% | |||
| $248,420.59 | $455,818.18 | -45.50% | |||
| $197,000.00 | $399,900.00 | -50.73% | |||
| $191,250.00 | $370,000.00 | -48.31% | |||
| 91.29% | 87.98% | 3.75% | |||
| 83 | 179 | -53.42% | |||
Listing link to the properties in Gilford:
http://www.adamdow.com/gilford/just-listed-wolfeboro/
Pinterest link:
https://www.pinterest.com/adamdow/gilford-new-hampshire/
.webp)


Social Media Links