
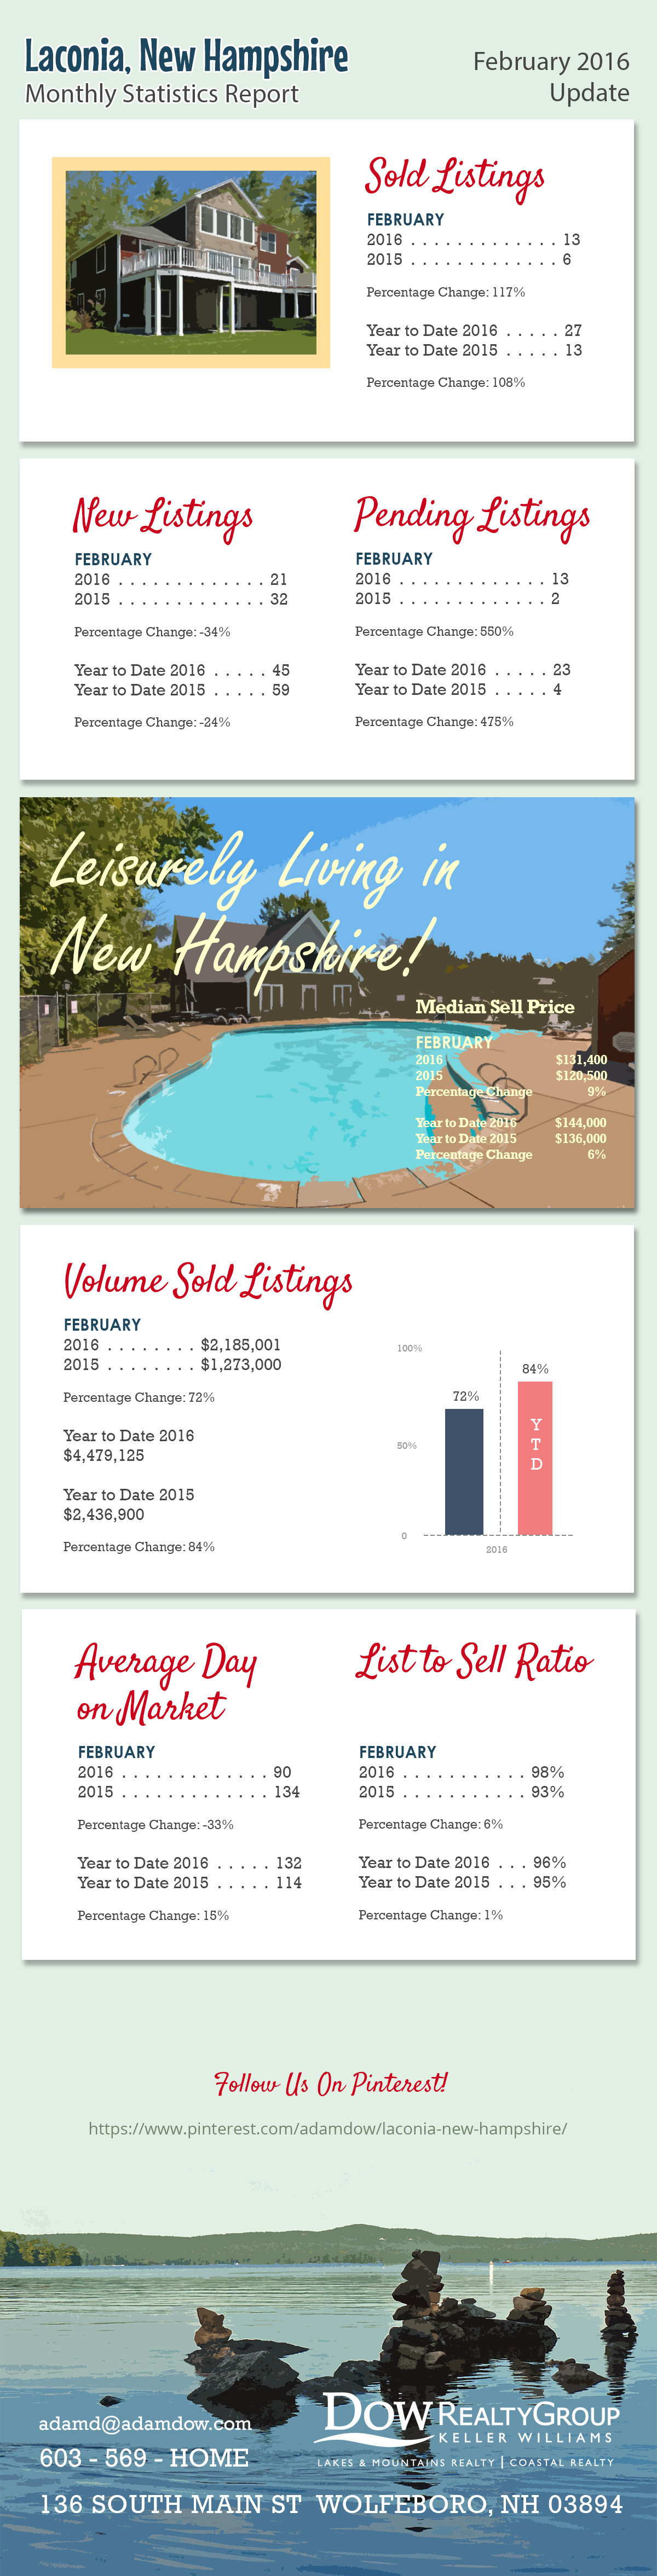
The following is the monthly statistics report for the town of Laconia as of February 2016.
Raw Data from MLS:
| MONTHLY STATISTICS REPORT - 02/01/2016 - 02/29/2016 | |||||
| LACONIA | |||||
| Northern New England Real Estate Network - Compiled on March 3, 2016 | |||||
| Change from | |||||
| 02/01/2016 - 02/29/2016 | 02/01/2015 - 02/28/2015 | 02/01/2015 - 02/28/2015 to | |||
| 02/01/2016 - 02/29/2016 | |||||
| Res/Condo/Mfd/Mobile | |||||
| New Listings | 21 | 32 | -34.37% | ||
| Sold Listings | 13 | 6 | 116.66% | ||
| Pending Listings | 13 | 2 | 550% | ||
| Vol. Sold Listings | $2,185,001.00 | $1,273,000.00 | 71.64% | ||
| Avg. Sell Price | $168,077.00 | $212,166.67 | -20.78% | ||
| Median List Price | $154,900.00 | $125,000.00 | 23.92% | ||
| Median Sell Price | $131,400.00 | $120,500.00 | 9.04% | ||
| List to Sell Ratio | 98.41% | 92.61% | 6.26% | ||
| Avg. Day on Market | 90 | 134 | -32.97% | ||
| YTD | YTD | 2015 - 2016 | |||
| 2016 | 2015 | YTD | |||
| 45 | 59 | -23.72% | |||
| 27 | 13 | 107.69% | |||
| 23 | 4 | 475% | |||
| $4,479,125.00 | $2,436,900.00 | 83.80% | |||
| $165,893.52 | $187,453.85 | -11.50% | |||
| $154,900.00 | $145,000.00 | 6.82% | |||
| $144,000.00 | $136,000.00 | 5.88% | |||
| 96.14% | 94.76% | 1.45% | |||
| 132 | 114 | 15.35% | |||
Listing link to the properties in Laconia:
http://www.adamdow.com/just-listed/just-listed-laconia/
Pinterest link:
https://www.pinterest.com/adamdow/laconia-new-hampshire/
.webp)


Social Media Links