
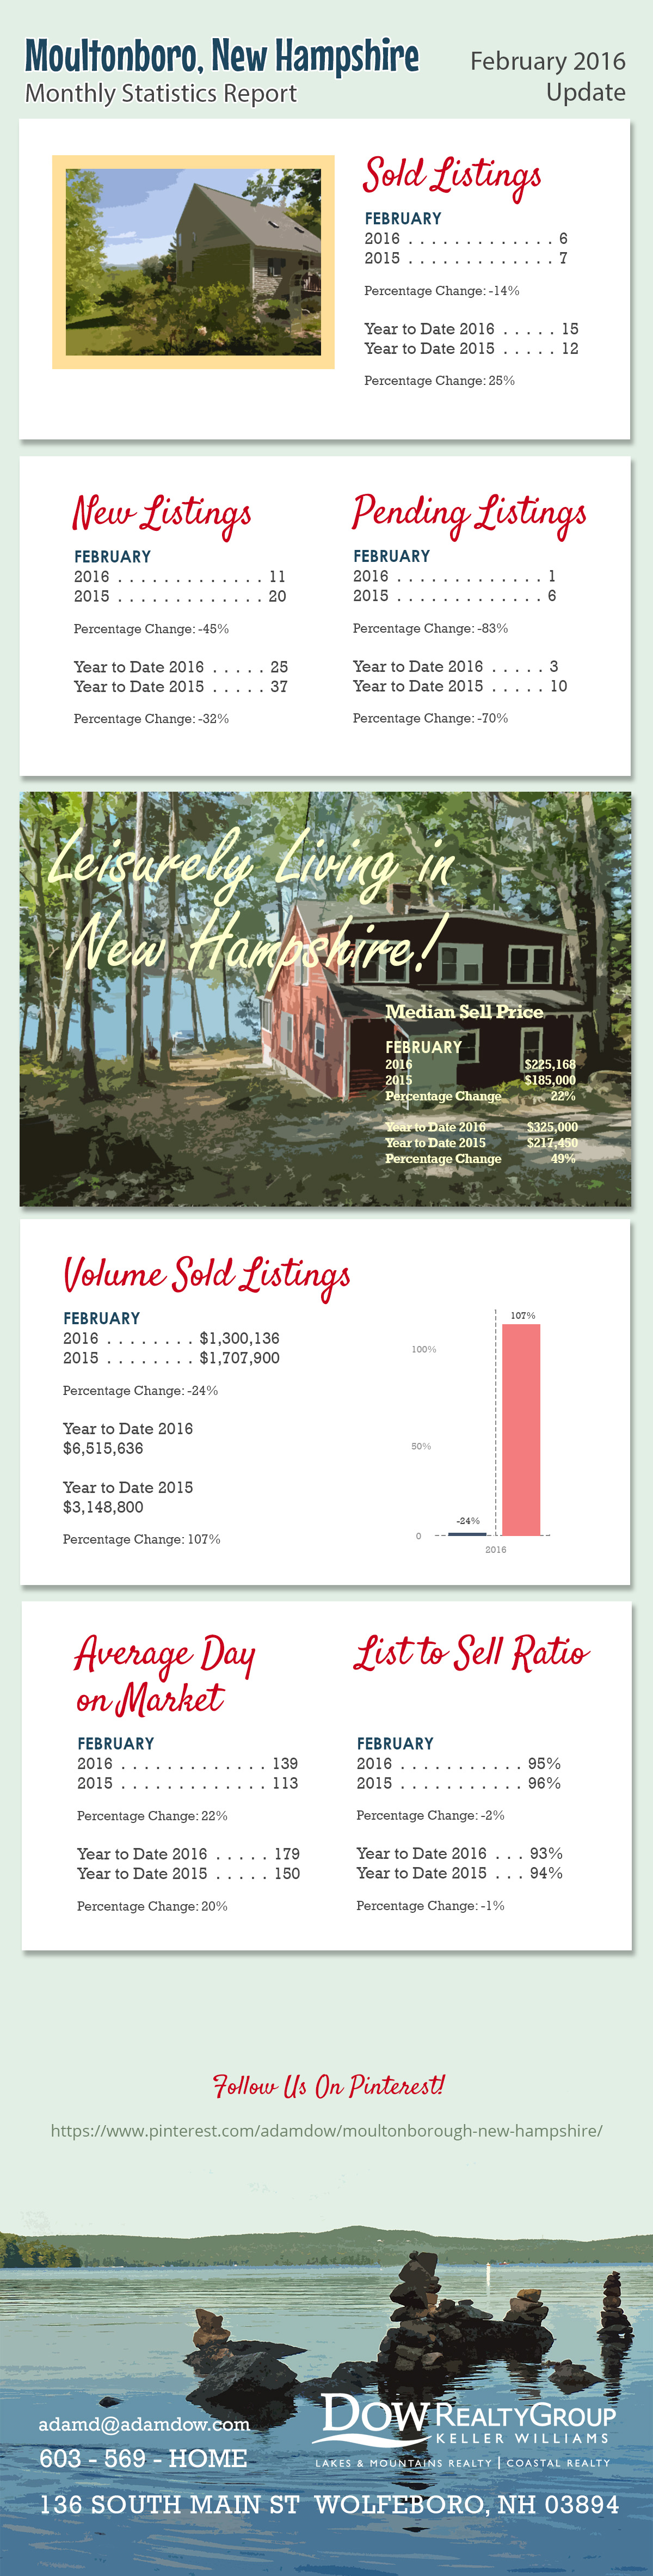
The following is the monthly statistics report for the town of Moultonboro as of February 2016.
Raw Data from MLS:
| MONTHLY STATISTICS REPORT - 02/01/2016 - 02/29/2016 | |||||
| MOULTONBORO | |||||
| Northern New England Real Estate Network - Compiled on March 3, 2016 | |||||
| Change from | |||||
| 02/01/2016 - 02/29/2016 | 02/01/2015 - 02/28/2015 | 02/01/2015 - 02/28/2015 to | |||
| 02/01/2016 - 02/29/2016 | |||||
| Res/Condo/Mfd/Mobile | |||||
| New Listings | 11 | 20 | -45% | ||
| Sold Listings | 6 | 7 | -14.28% | ||
| Pending Listings | 1 | 6 | -83.33% | ||
| Vol. Sold Listings | $1,300,136.00 | $1,707,900.00 | -23.87% | ||
| Avg. Sell Price | $216,689.33 | $243,985.71 | -11.18% | ||
| Median List Price | $244,000.00 | $199,900.00 | 22.06% | ||
| Median Sell Price | $225,168.00 | $185,000.00 | 21.71% | ||
| List to Sell Ratio | 94.52% | 96.48% | -2.03% | ||
| Avg. Day on Market | 139 | 113 | 22.40% | ||
| YTD | YTD | 2015 - 2016 | |||
| 2016 | 2015 | YTD | |||
| 25 | 37 | -32.43% | |||
| 15 | 12 | 25% | |||
| 3 | 10 | -70% | |||
| $6,515,636.00 | $3,148,800.00 | 106.92% | |||
| $434,375.73 | $262,400.00 | 65.53% | |||
| $349,900.00 | $220,900.00 | 58.39% | |||
| $325,000.00 | $217,450.00 | 49.45% | |||
| 93.27% | 93.96% | -0.73% | |||
| 179 | 150 | 19.51% | |||
Listing link to the properties in Moultonboro:
http://www.adamdow.com/just-listed/just-listed-moultonborough/
Pinterest link:
https://www.pinterest.com/adamdow/moultonborough-new-hampshire/
.webp)


Social Media Links