
The following is the monthly statistics report for the town of Tuftonboro as of February 2016.
Raw Data from MLS:
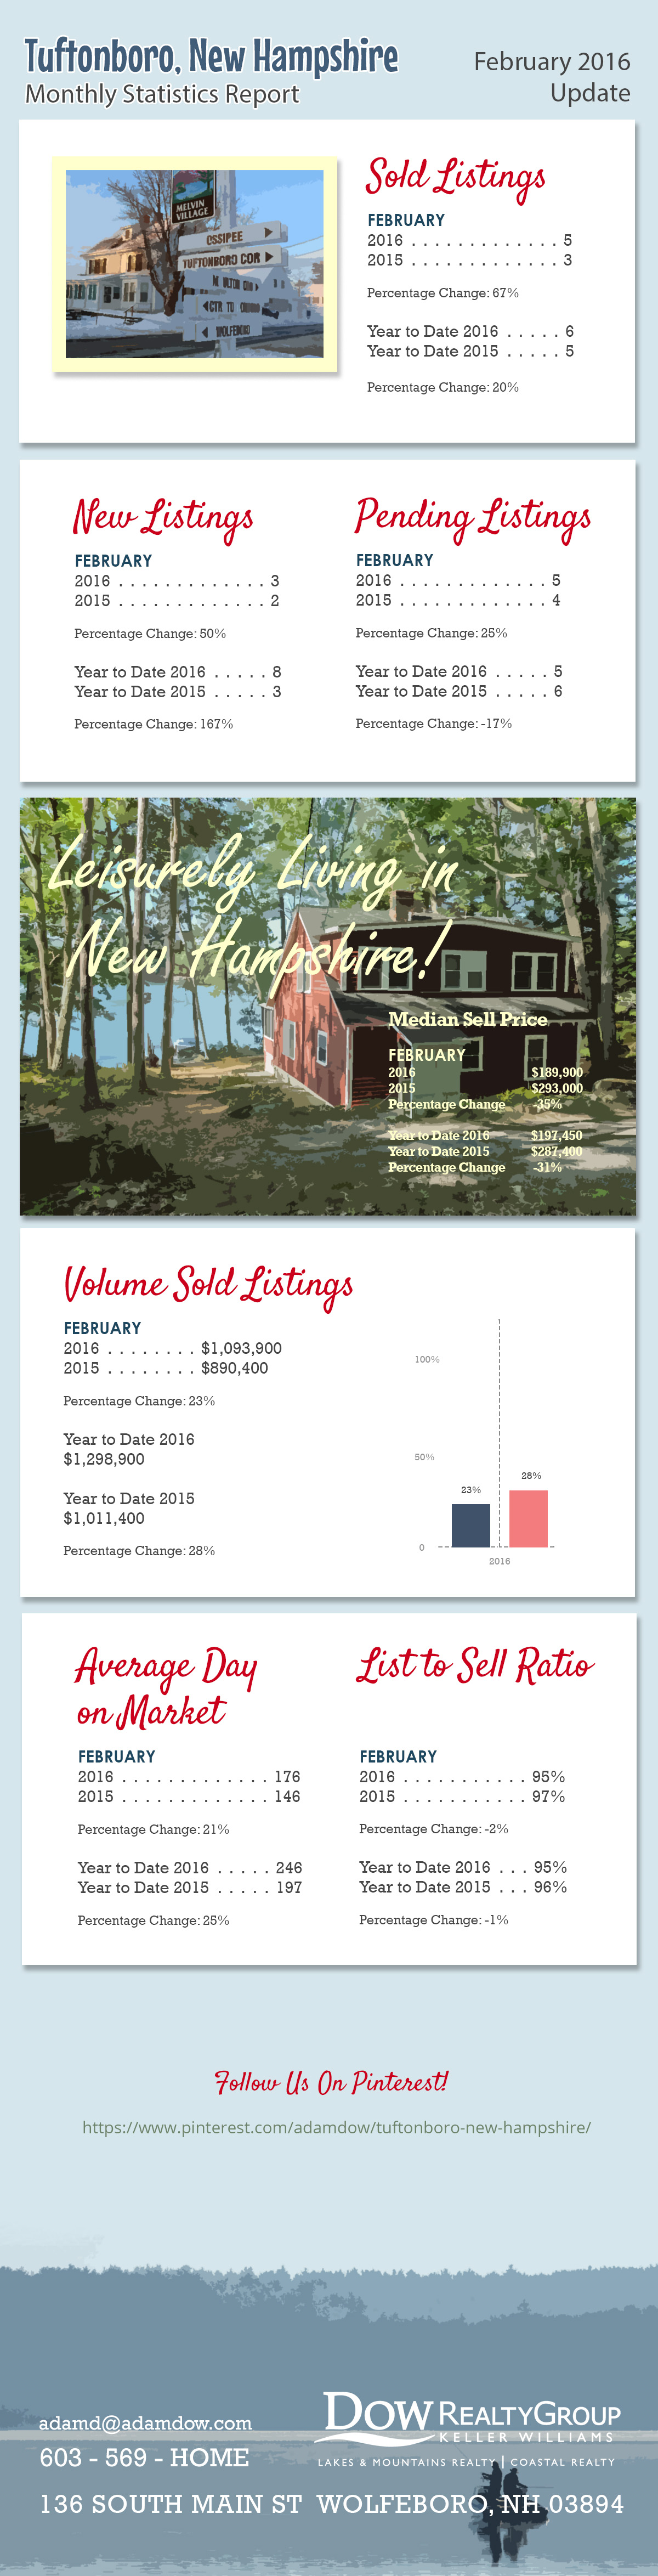
| MONTHLY STATISTICS REPORT - 02/01/2016 - 02/29/2016 | |||||
| Northern New England Real Estate Network - Compiled on March 3, 2016 | |||||
| TUFTONBORO | |||||
| Change from | |||||
| 02/01/2016 - 02/29/2016 | 02/01/2015 - 02/28/2015 | 02/01/2015 - 02/28/2015 to | |||
| 02/01/2016 - 02/29/2016 | |||||
| Res/Condo/Mfd/Mobile | |||||
| New Listings | 3 | 2 | 50% | ||
| Sold Listings | 5 | 3 | 66.66% | ||
| Pending Listings | 5 | 4 | 25% | ||
| Vol. Sold Listings | $1,093,900.00 | $890,400.00 | 22.85% | ||
| Avg. Sell Price | $218,780.00 | $296,800.00 | -26.28% | ||
| Median List Price | $189,900.00 | $299,900.00 | -36.67% | ||
| Median Sell Price | $189,900.00 | $293,000.00 | -35.18% | ||
| List to Sell Ratio | 95.13% | 96.90% | -1.82% | ||
| Avg. Day on Market | 176 | 146 | 21.09% | ||
| YTD | YTD | 2015 - 2016 | |||
| 2016 | 2015 | YTD | |||
| 8 | 3 | 166.66% | |||
| 6 | 5 | 20% | |||
| 5 | 6 | -16.66% | |||
| $1,298,900.00 | $1,011,400.00 | 28.42% | |||
| $216,483.33 | $202,280.00 | 7.02% | |||
| $201,950.00 | $299,900.00 | -32.66% | |||
| $197,450.00 | $287,400.00 | -31.29% | |||
| 95.24% | 96.45% | -1.25% | |||
| 246 | 197 | 24.66% | |||
Listing link to the properties in Tuftonboro:
http://www.adamdow.com/just-listed/just-listed-tuftonboro/
Pinterest link:
.webp)


Social Media Links