
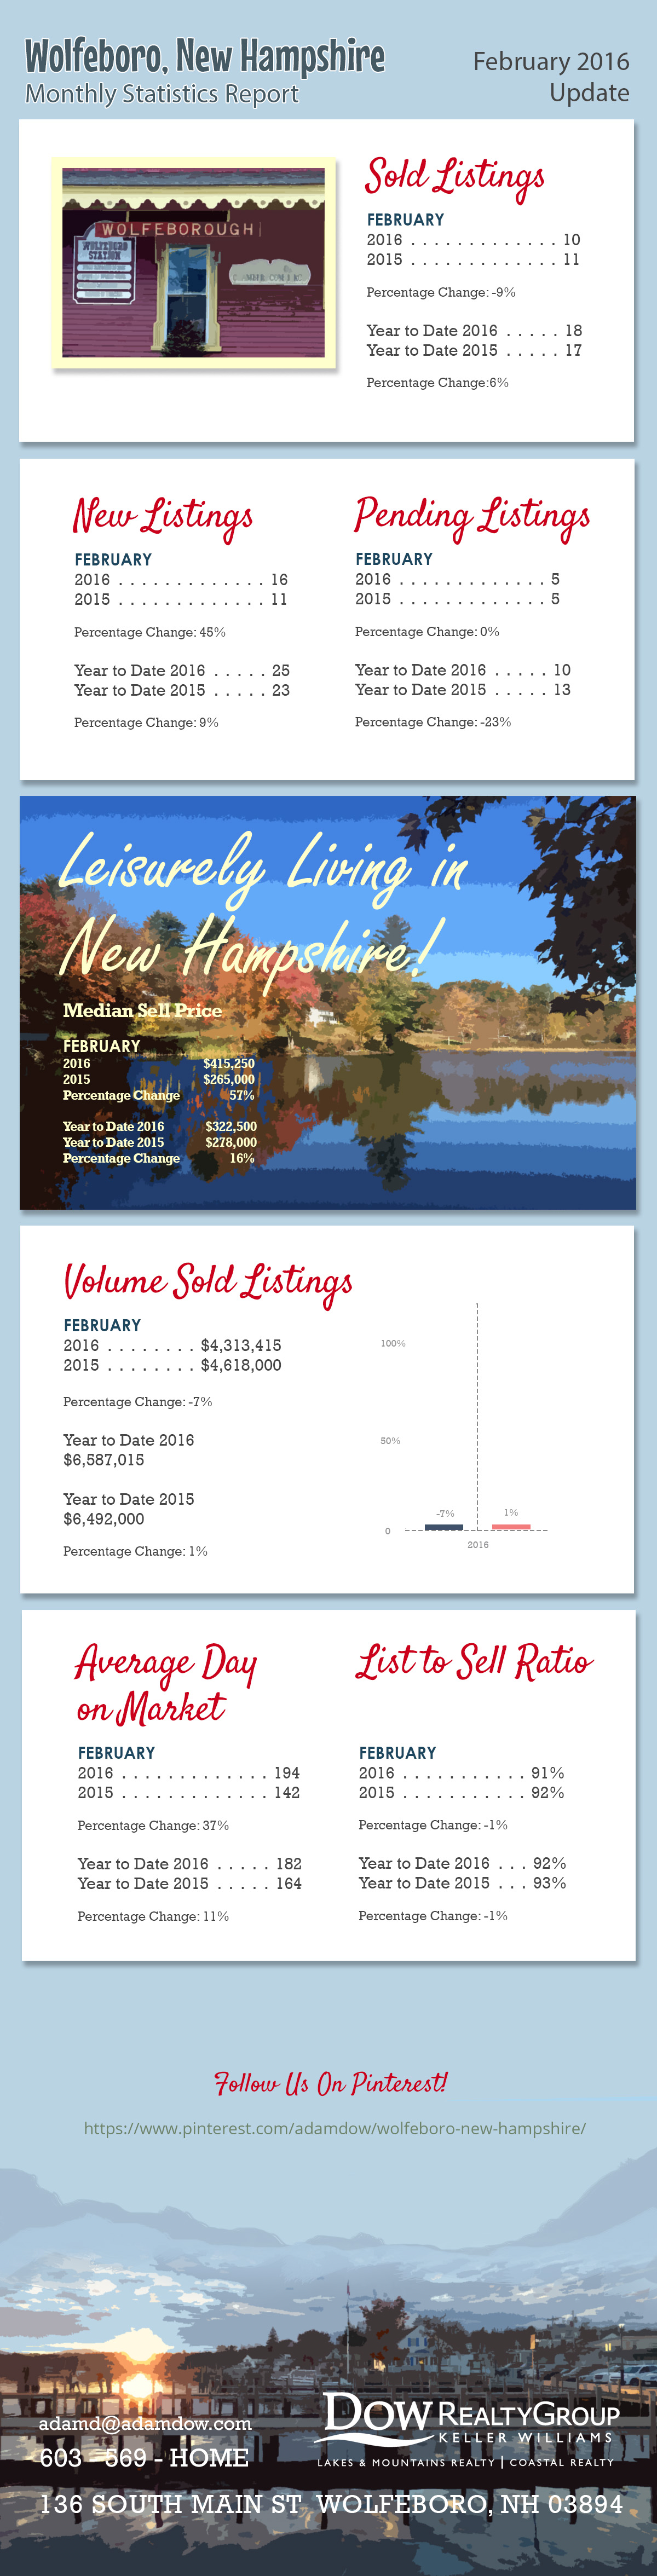
The following is the monthly statistics report for the town of Wolfeboro as of February 2016.
Raw Data from MLS:
| WOLFEBORO | ||||
| Northern New England Real Estate Network - Compiled on March 3, 2016 | ||||
| Change from | ||||
| 02/01/2016 - 02/29/2016 | 02/01/2015 - 02/28/2015 | 02/01/2015 - 02/28/2015 to | ||
| 02/01/2016 - 02/29/2016 | ||||
| Res/Condo/Mfd/Mobile | ||||
| New Listings | 16 | 11 | 45.45% | |
| Sold Listings | 10 | 11 | -9.09% | |
| Pending Listings | 5 | 5 | 0 | |
| Vol. Sold Listings | $4,313,415.00 | $4,618,000.00 | -6.59% | |
| Avg. Sell Price | $431,341.50 | $419,818.18 | 2.74% | |
| Median List Price | $441,000.00 | $288,000.00 | 53.12% | |
| Median Sell Price | $415,250.00 | $265,000.00 | 56.69% | |
| List to Sell Ratio | 91.74% | 92.42% | -0.73% | |
| Avg. Day on Market | 194 | 142 | 36.63% | |
| YTD | YTD | 2015 - 2016 | ||
| 2016 | 2015 | YTD | ||
| 25 | 23 | 8.69% | ||
| 18 | 17 | 5.88% | ||
| 10 | 13 | -23.07% | ||
| $6,587,015.00 | $6,492,000.00 | 1.46% | ||
| $365,945.28 | $381,882.35 | -4.17% | ||
| $362,500.00 | $298,800.00 | 21.31% | ||
| $322,500.00 | $278,000.00 | 16.00% | ||
| 91.81% | 93.19% | -1.47% | ||
| 182 | 164 | 11.18% |
Listing link to the properties in Wolfeboro:
http://www.adamdow.com/wolfeboro/just-listed-wolfeboro/
Pinterest link:
.webp)


Social Media Links