
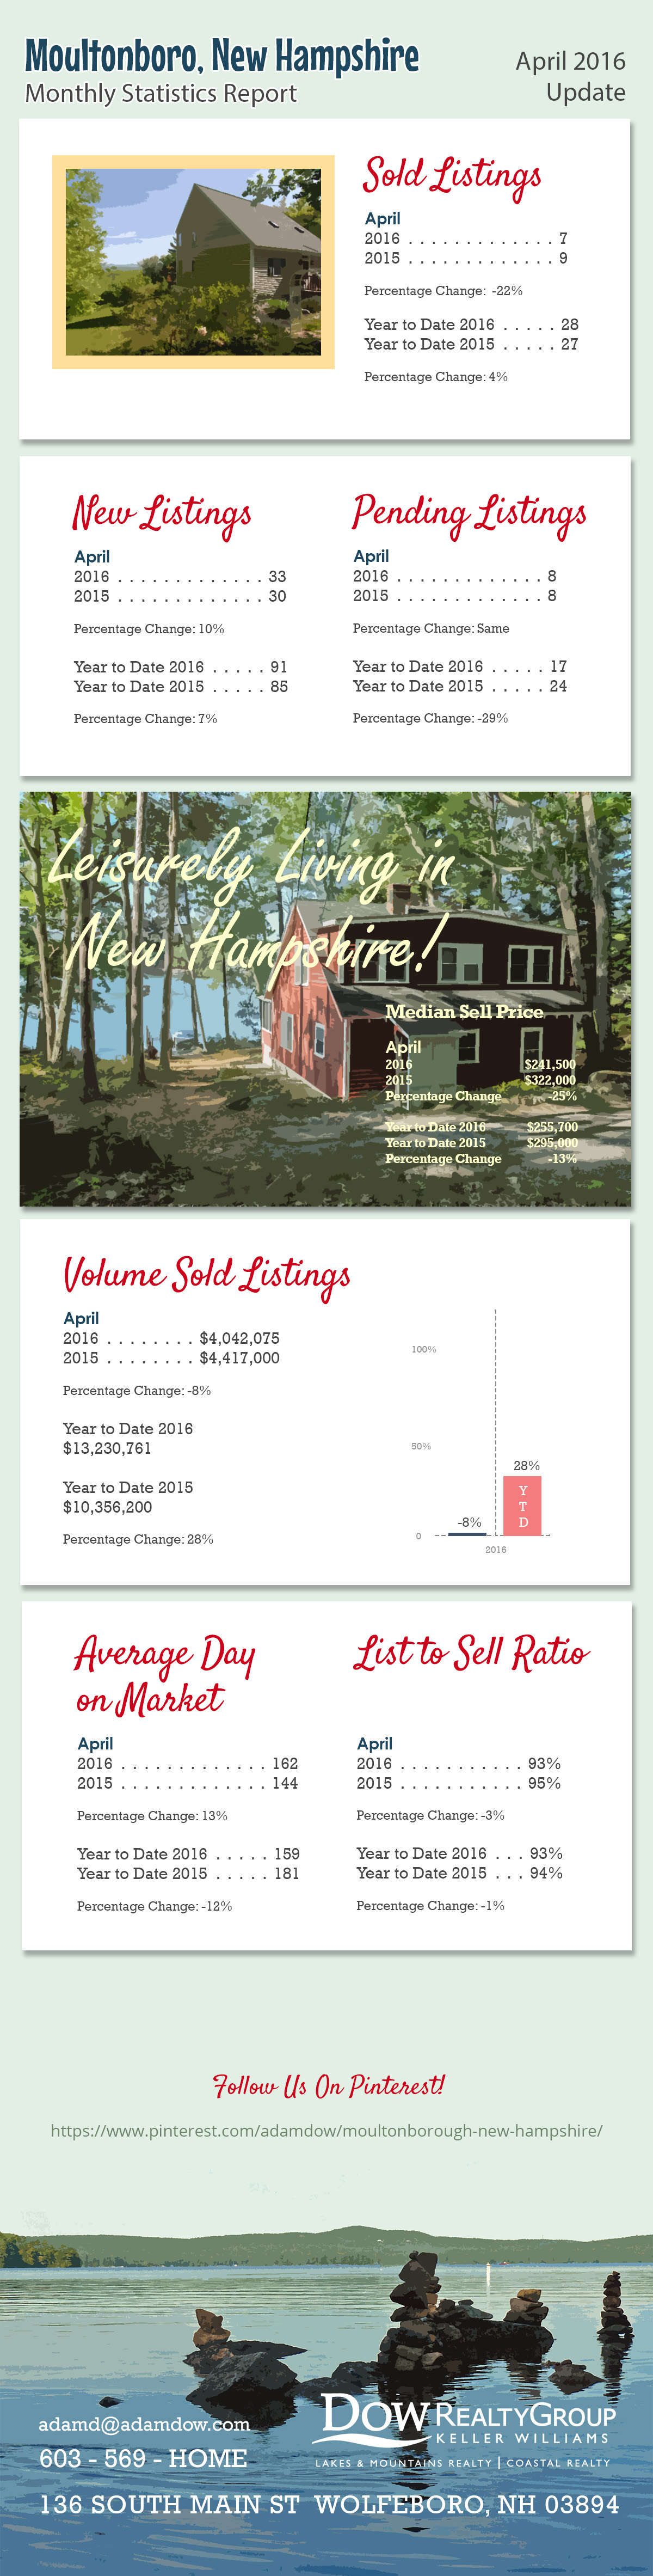
The following is the monthly statistics report for the town of Moultonboro as of April 2016.
Raw Data from MLS:
| MONTHLY STATISTICS REPORT - 04/01/2016 - 04/30/2016 | ||||
| Northern New England Real Estate Network - Compiled on May 3, 2016 | MOULTONBORO | |||
| Change from | Change from | |||
| 04/01/2016 - 04/30/2016 | 03/02/2016 - 03/31/2016 | 04/01/2015 - 04/30/2015 | 04/01/2015 - 04/30/2015 to | |
| 04/01/2016 - 04/30/2016 | ||||
| Res/Condo/Mfd/Mobile | ||||
| New Listings | 33 | 6.45% | 30 | 10% |
| Sold Listings | 7 | 16.66% | 9 | -22.22% |
| Pending Listings | 8 | 33.33% | 8 | 0 |
| Vol. Sold Listings | $4,042,075.00 | 51.21% | $4,417,000.00 | -8.48% |
| Avg. Sell Price | $577,439.29 | 29.61% | $490,777.78 | 17.65% |
| Median List Price | $259,900.00 | 17.23% | $349,000.00 | -25.53% |
| Median Sell Price | $241,500.00 | 11.44% | $322,000.00 | -25% |
| List to Sell Ratio | 92.87% | -0.80% | 95.30% | -2.54% |
| Avg. Day on Market | 162 | 55.10% | 144 | 12.54% |
| YTD | YTD | 2015 - 2016 | ||
| 2016 | 2015 | YTD | ||
| 91 | 85 | 7.05% | ||
| 28 | 27 | 3.70% | ||
| 17 | 24 | -29.16% | ||
| ############ | ######## | 27.75% | ||
| $472,527.18 | ######## | 23.19% | ||
| $274,450.00 | ######## | -8.21% | ||
| $255,700.00 | ######## | -13.32% | ||
| 93.22% | 93.91% | -0.73% | ||
| 159 | 181 | -12.10% | ||
Listing link to the properties in Moultonboro:
http://www.adamdow.com/just-listed/just-listed-moultonborough/
Pinterest link:
https://www.pinterest.com/adamdow/moultonborough-new-hampshire/
.webp)


Social Media Links