
The following is the monthly statistics report for the town of Wolfeboro as of April 2016.
Raw Data from MLS:
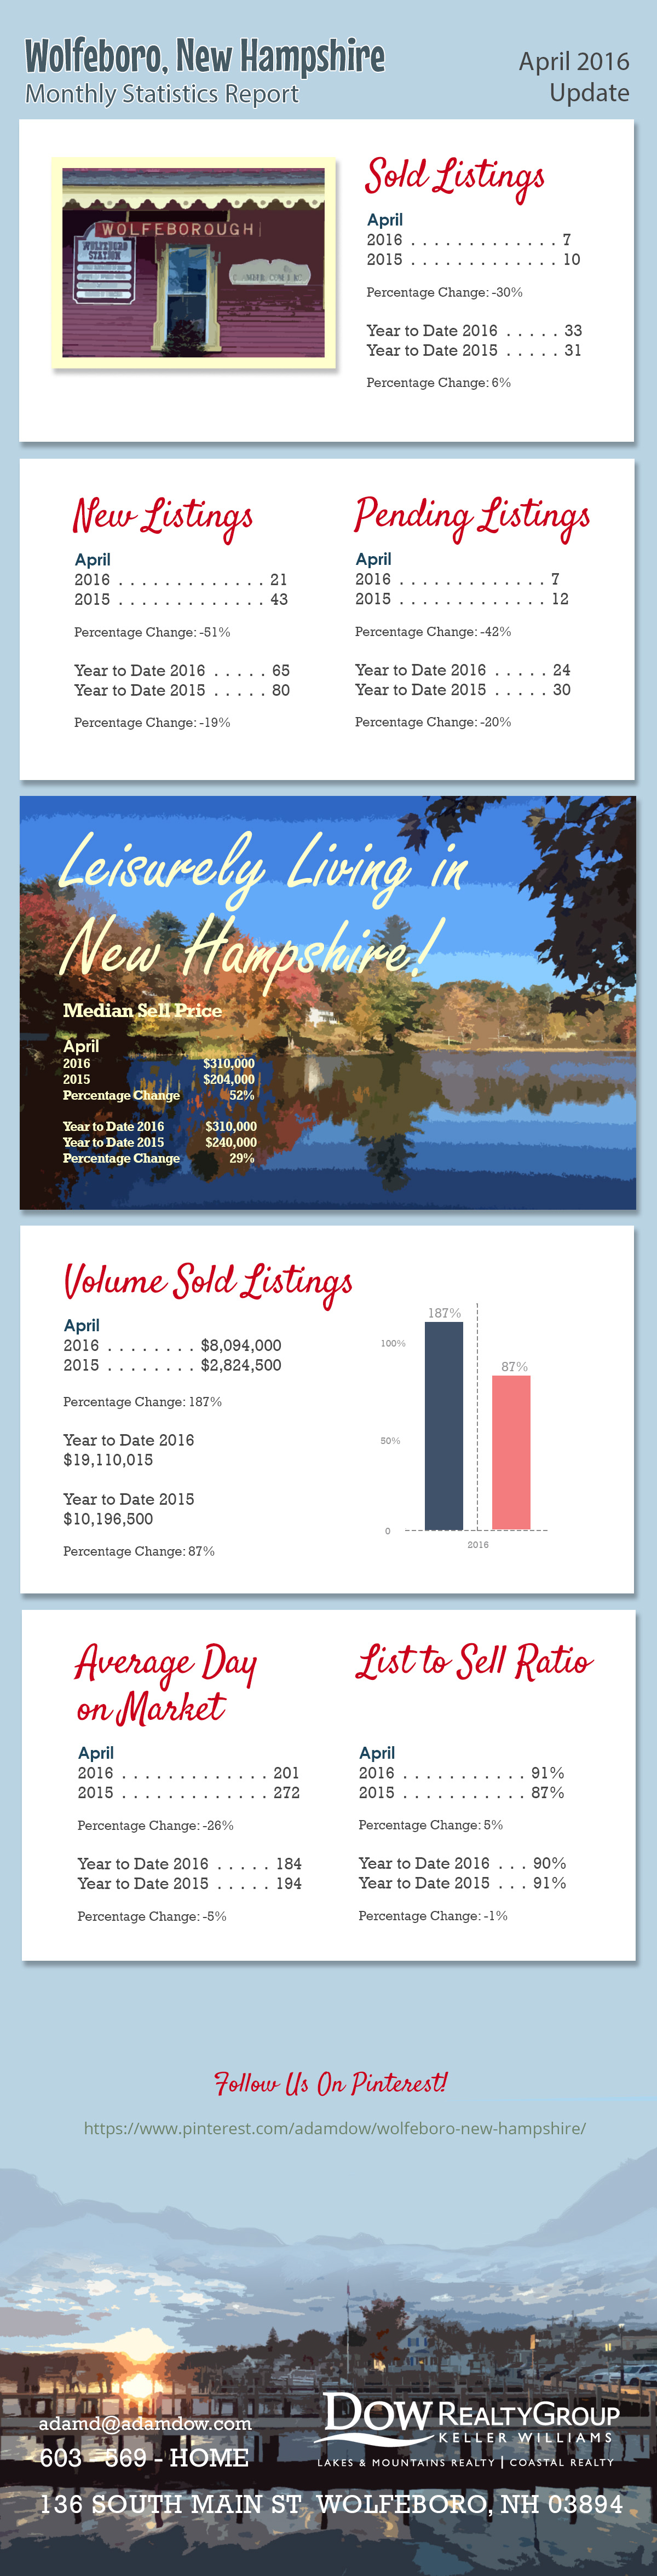
| MONTHLY STATISTICS REPORT - 04/01/2016 - 04/30/2016 | ||||
| Northern New England Real Estate Network - Compiled on May 3, 2016 | WOLFEBORO | |||
| Change from | Change from | |||
| 04/01/2016 - 04/30/2016 | 03/02/2016 - 03/31/2016 | 04/01/2015 - 04/30/2015 | 04/01/2015 - 04/30/2015 to | |
| 04/01/2016 - 04/30/2016 | ||||
| Res/Condo/Mfd/Mobile | ||||
| New Listings | 21 | 50% | 43 | -51.16% |
| Sold Listings | 7 | -12.50% | 10 | -30% |
| Pending Listings | 7 | 0 | 12 | -41.66% |
| Vol. Sold Listings | $8,094,000.00 | 82.75% | $2,824,500.00 | 186.56% |
| Avg. Sell Price | $1,156,285.71 | 108.85% | $282,450.00 | 309.37% |
| Median List Price | $344,900.00 | -13.45% | $213,900.00 | 61.24% |
| Median Sell Price | $310,000.00 | -17.88% | $204,000.00 | 51.96% |
| List to Sell Ratio | 91.03% | 4.51% | 86.82% | 4.85% |
| Avg. Day on Market | 201 | 14.93% | 272 | -25.91% |
| YTD | YTD | 2015 - 2016 | ||
| 2016 | 2015 | YTD | ||
| 65 | 80 | -18.75% | ||
| 33 | 31 | 6.45% | ||
| 24 | 30 | -20% | ||
| $19,110,015.00 | ############ | 87.41% | ||
| $579,091.36 | $328,919.35 | 76.05% | ||
| $350,000.00 | $249,000.00 | 40.56% | ||
| $310,000.00 | $240,000.00 | 29.16% | ||
| 90.35% | 91.34% | -1.07% | ||
| 184 | 194 | -5.01% | ||
Listing link to the properties in Wolfeboro:
http://www.adamdow.com/wolfeboro/just-listed-wolfeboro/
Pinterest link:
.webp)


Social Media Links