
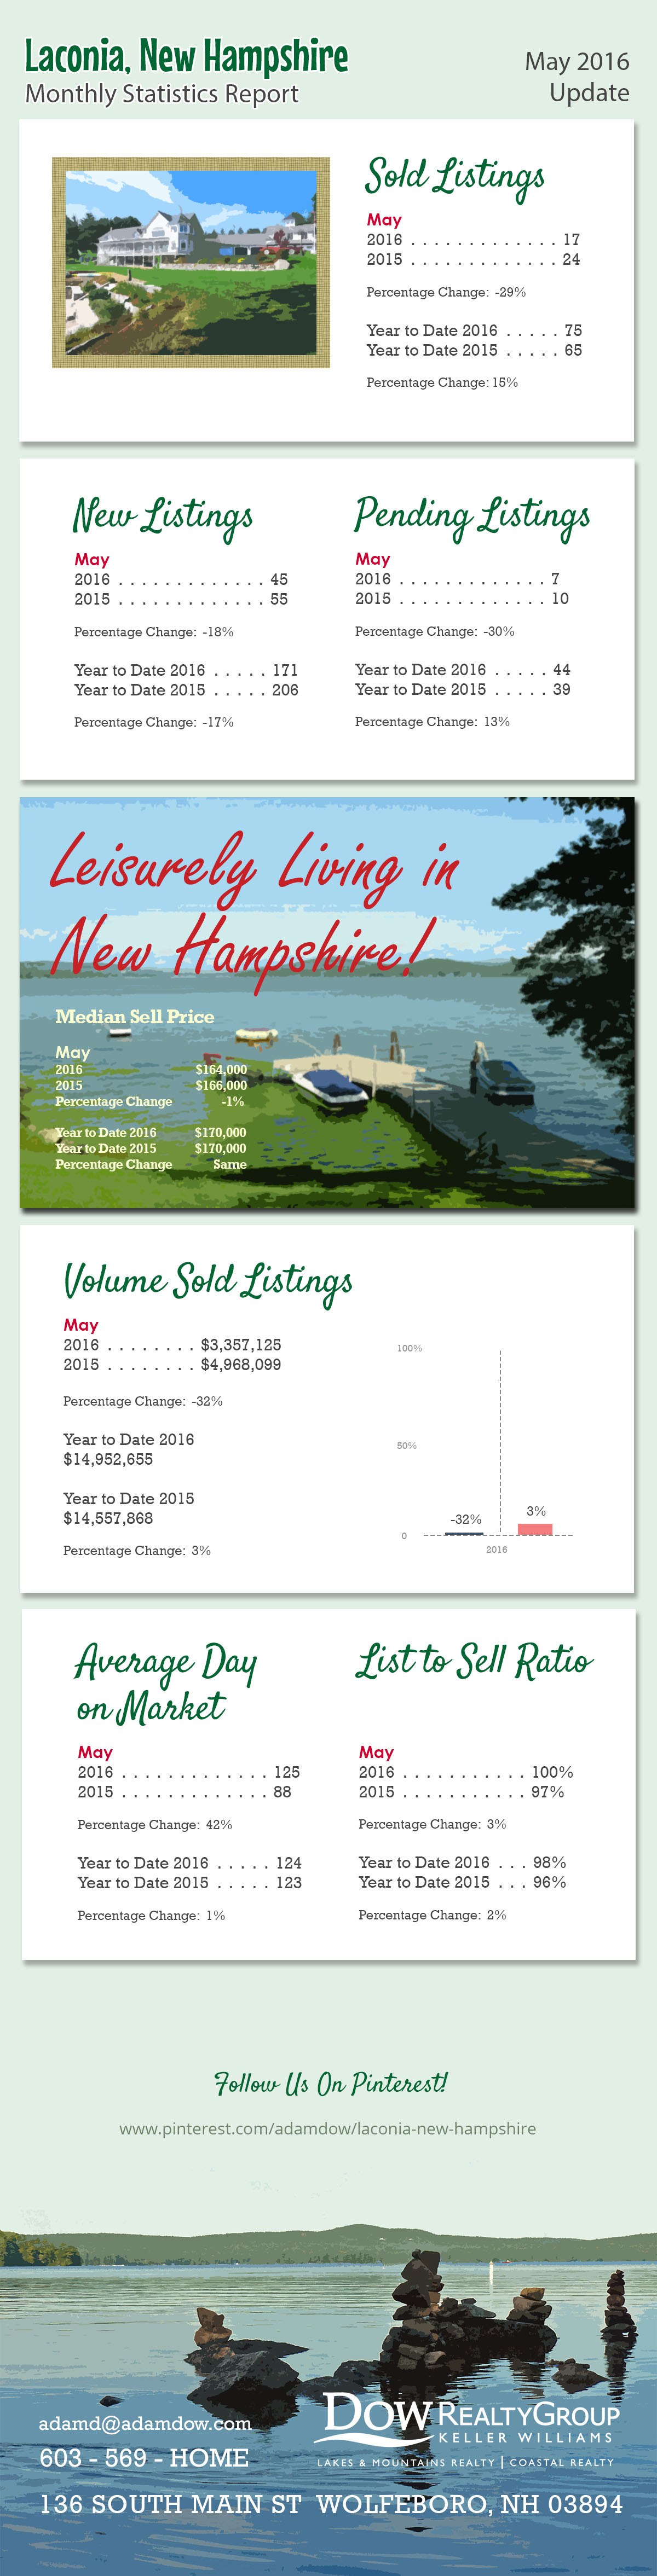
The following is the monthly statistics report for the town of Laconia as of May 2016.
Raw Data from MLS:
| MONTHLY STATISTICS REPORT - 05/01/2016 - 05/31/2016 | ||||
| LACONIA | ||||
| Northern New England Real Estate Network - Compiled on June 13, 2016 | ||||
| Change from | Change from | |||
| 05/01/2016 - 05/31/2016 | 03/31/2016 - 04/30/2016 | 05/01/2015 - 05/31/2015 | 05/01/2015 - 05/31/2015 to | |
| 05/01/2016 - 05/31/2016 | ||||
| Res/Condo/Mfd/Mobile | ||||
| New Listings | 45 | -4.25% | 55 | -18.18% |
| Sold Listings | 17 | -5.55% | 24 | -29.16% |
| Pending Listings | 7 | -30% | 10 | -30% |
| Vol. Sold Listings | $3,357,125.00 | -20.28% | $4,968,099.00 | -32.42% |
| Avg. Sell Price | $197,477.94 | -15.59% | $207,004.13 | -4.60% |
| Median List Price | $163,000.00 | -28.33% | $163,700.00 | -0.42% |
| Median Sell Price | $164,000.00 | -31.06% | $166,000.00 | -1.20% |
| List to Sell Ratio | 99.76% | 3.03% | 97.41% | 2.41% |
| Avg. Day on Market | 125 | 8.17% | 88 | 41.84% |
| YTD | YTD | 2015 - 2016 | ||
| 2016 | 2015 | YTD | ||
| 171 | 206 | -16.99% | ||
| 75 | 65 | 15.38% | ||
| 44 | 39 | 12.82% | ||
| $14,952,655.00 | $14,557,868.00 | 2.71% | ||
| $199,368.73 | $223,967.20 | -10.98% | ||
| $175,000.00 | $169,900.00 | 3.00% | ||
| $170,000.00 | $170,000.00 | 0 | ||
| 97.50% | 96.41% | 1.13% | ||
| 124 | 123 | 1.17% | ||
Listing link to the properties in Laconia:
http://www.adamdow.com/just-listed/just-listed-laconia/
Pinterest link:
.webp)


Social Media Links