
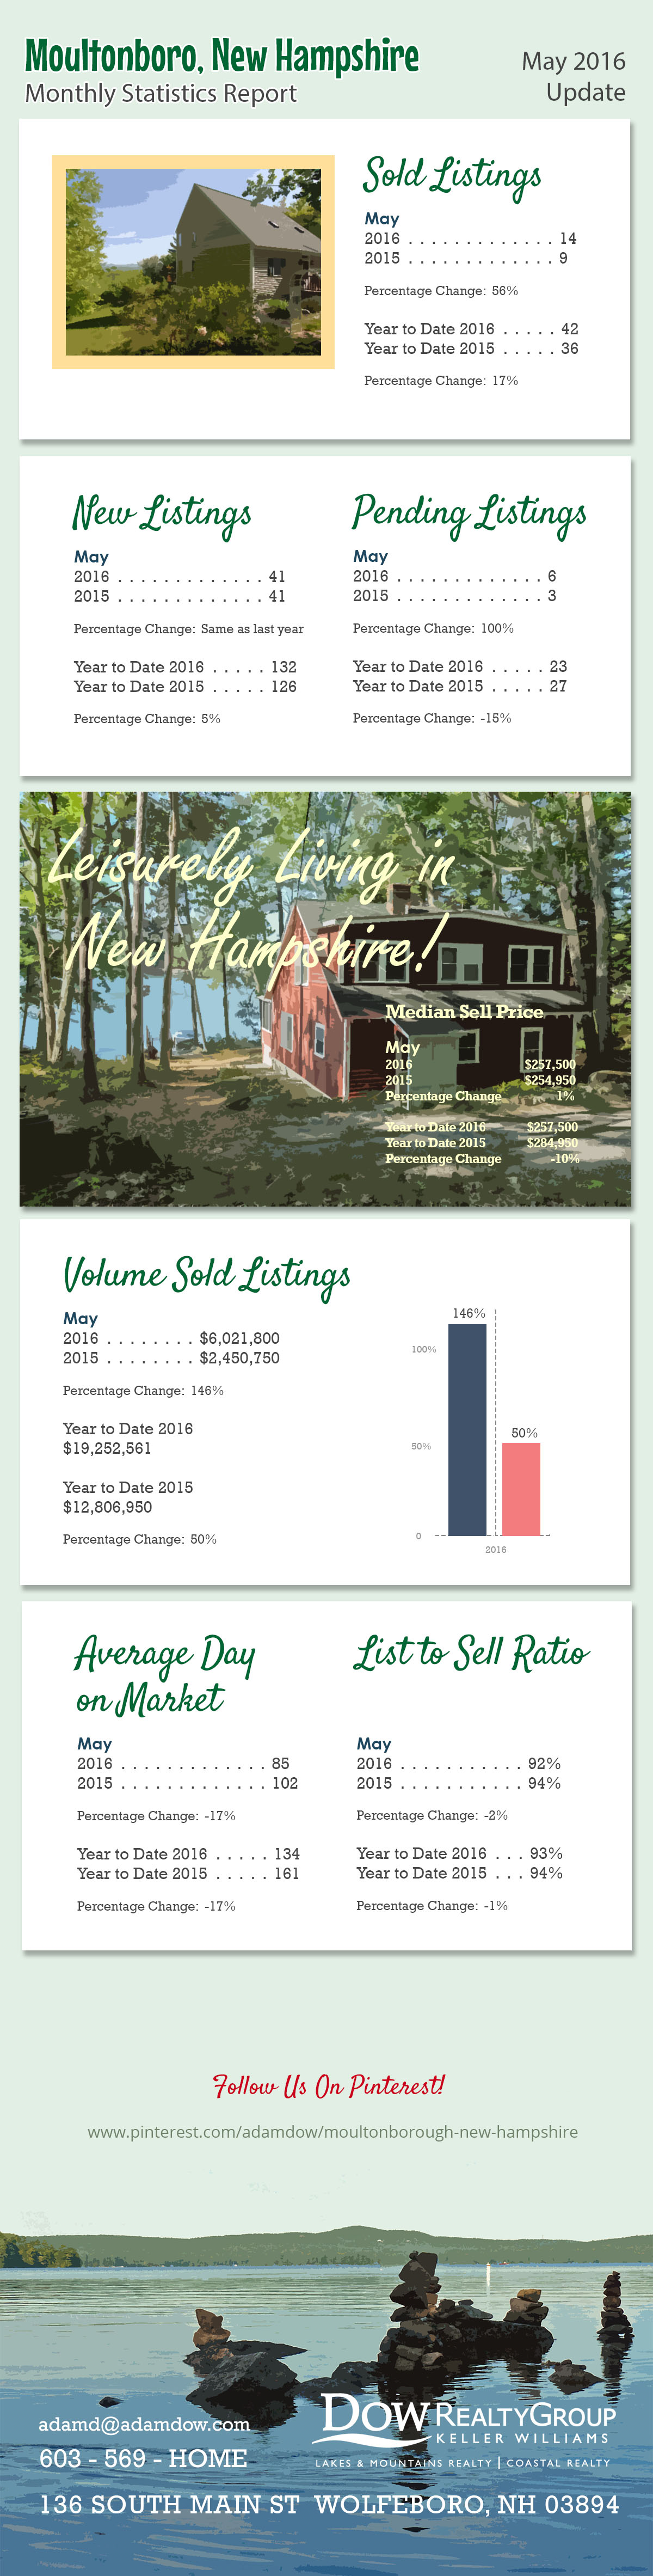
The following is the monthly statistics report for the town of Moultonboro as of May 2016.
Raw Data from MLS:
| MONTHLY STATISTICS REPORT - 05/01/2016 - 05/31/2016 | ||||
| MOULTONBORO | ||||
| Northern New England Real Estate Network - Compiled on June 13, 2016 | ||||
| Change from | Change from | |||
| 05/01/2016 - 05/31/2016 | 03/31/2016 - 04/30/2016 | 05/01/2015 - 05/31/2015 | 05/01/2015 - 05/31/2015 to | |
| 05/01/2016 - 05/31/2016 | ||||
| Res/Condo/Mfd/Mobile | ||||
| New Listings | 41 | 20.58% | 41 | 0 |
| Sold Listings | 14 | 75% | 9 | 55.55% |
| Pending Listings | 6 | -25% | 3 | 100% |
| Vol. Sold Listings | $6,021,800.00 | 41.95% | $2,450,750.00 | 145.71% |
| Avg. Sell Price | $430,128.57 | -18.88% | $272,305.56 | 57.95% |
| Median List Price | $269,500.00 | 5.72% | $259,900.00 | 3.69% |
| Median Sell Price | $257,500.00 | 6.95% | $254,950.00 | 1.00% |
| List to Sell Ratio | 91.83% | -1.23% | 94.31% | -2.63% |
| Avg. Day on Market | 85 | -45.24% | 102 | -16.72% |
| YTD | YTD | 2015 - 2016 | ||
| 2016 | 2015 | YTD | ||
| 132 | 126 | 4.76% | ||
| 42 | 36 | 16.66% | ||
| 23 | 27 | -14.81% | ||
| $19,252,561.00 | $12,806,950.00 | 50.32% | ||
| $458,394.31 | $355,748.61 | 28.85% | ||
| $269,500.00 | $289,450.00 | -6.89% | ||
| $257,500.00 | $284,950.00 | -9.63% | ||
| 92.78% | 93.98% | -1.28% | ||
| 134 | 161 | -16.64% | ||
Listing link to the properties in Moultonboro:
http://www.adamdow.com/just-listed/just-listed-moultonborough/
Pinterest link:
https://www.pinterest.com/adamdow/moultonborough-new-hampshire/
.webp)


Social Media Links