
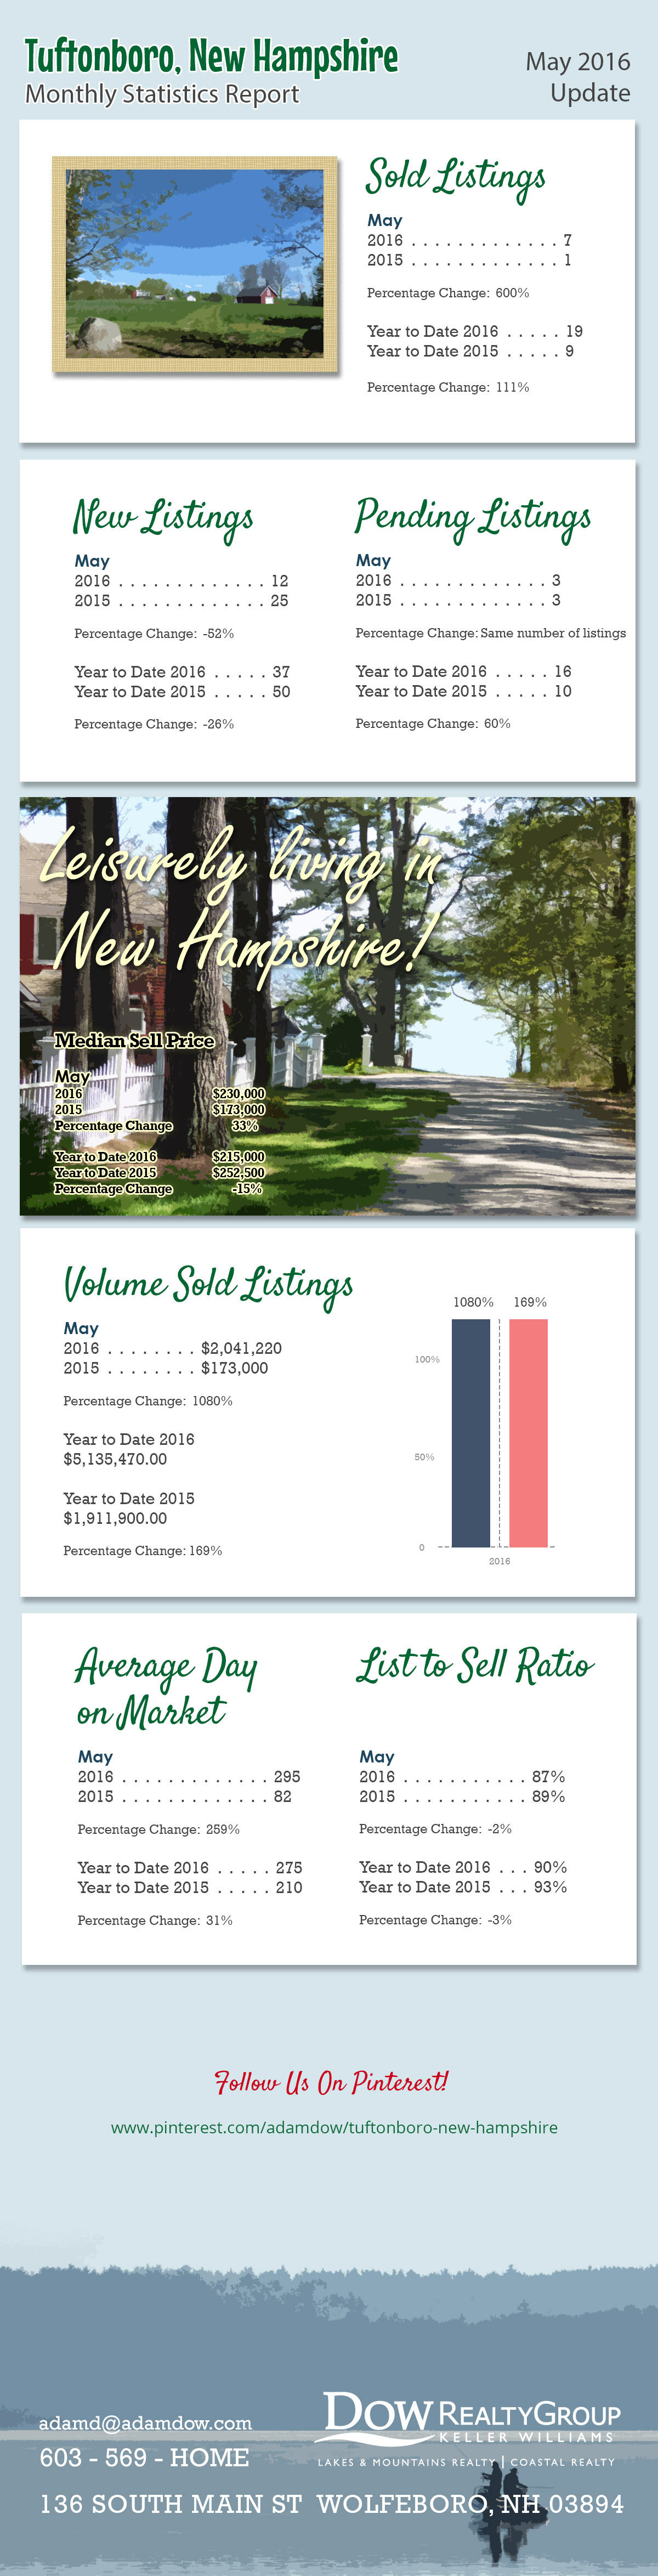
The following is the monthly statistics report for the town of Tuftonboro as of May 2016.
Raw Data from MLS:
| MONTHLY STATISTICS REPORT - 05/01/2016 - 05/31/2016 | ||||
| TUFTONBORO | ||||
| Northern New England Real Estate Network - Compiled on June 13, 2016 | ||||
| Change from | Change from | |||
| 05/01/2016 - 05/31/2016 | 03/31/2016 - 04/30/2016 | 05/01/2015 - 05/31/2015 | 05/01/2015 - 05/31/2015 to | |
| 05/01/2016 - 05/31/2016 | ||||
| Res/Condo/Mfd/Mobile | ||||
| New Listings | 12 | 50% | 25 | -52% |
| Sold Listings | 7 | 40% | 1 | 600% |
| Pending Listings | 3 | -50% | 3 | 0 |
| Vol. Sold Listings | $2,041,220.00 | 61.70% | $173,000.00 | 1079.89% |
| Avg. Sell Price | $291,602.86 | 15.50% | $173,000.00 | 68.55% |
| Median List Price | $239,000.00 | 8.68% | $195,000.00 | 22.56% |
| Median Sell Price | $230,000.00 | 15% | $173,000.00 | 32.94% |
| List to Sell Ratio | 87.42% | -4.58% | 88.71% | -1.46% |
| Avg. Day on Market | 295 | 26.05% | 82 | 259.40% |
| YTD | YTD | 2015 - 2016 | ||
| 2016 | 2015 | YTD | ||
| 37 | 50 | -26% | ||
| 19 | 9 | 111.11% | ||
| 16 | 10 | 60% | ||
| $5,135,470.00 | $1,911,900.00 | 168.60% | ||
| $270,287.89 | $212,433.33 | 27.23% | ||
| $225,000.00 | $299,000.00 | -24.74% | ||
| $215,000.00 | $252,500.00 | -14.85% | ||
| 90.48% | 93.69% | -3.42% | ||
| 275 | 210 | 31.19% | ||
Listing link to the properties in Tuftonboro:
http://www.adamdow.com/just-listed/just-listed-tuftonboro/
Pinterest link:
.webp)


Social Media Links