
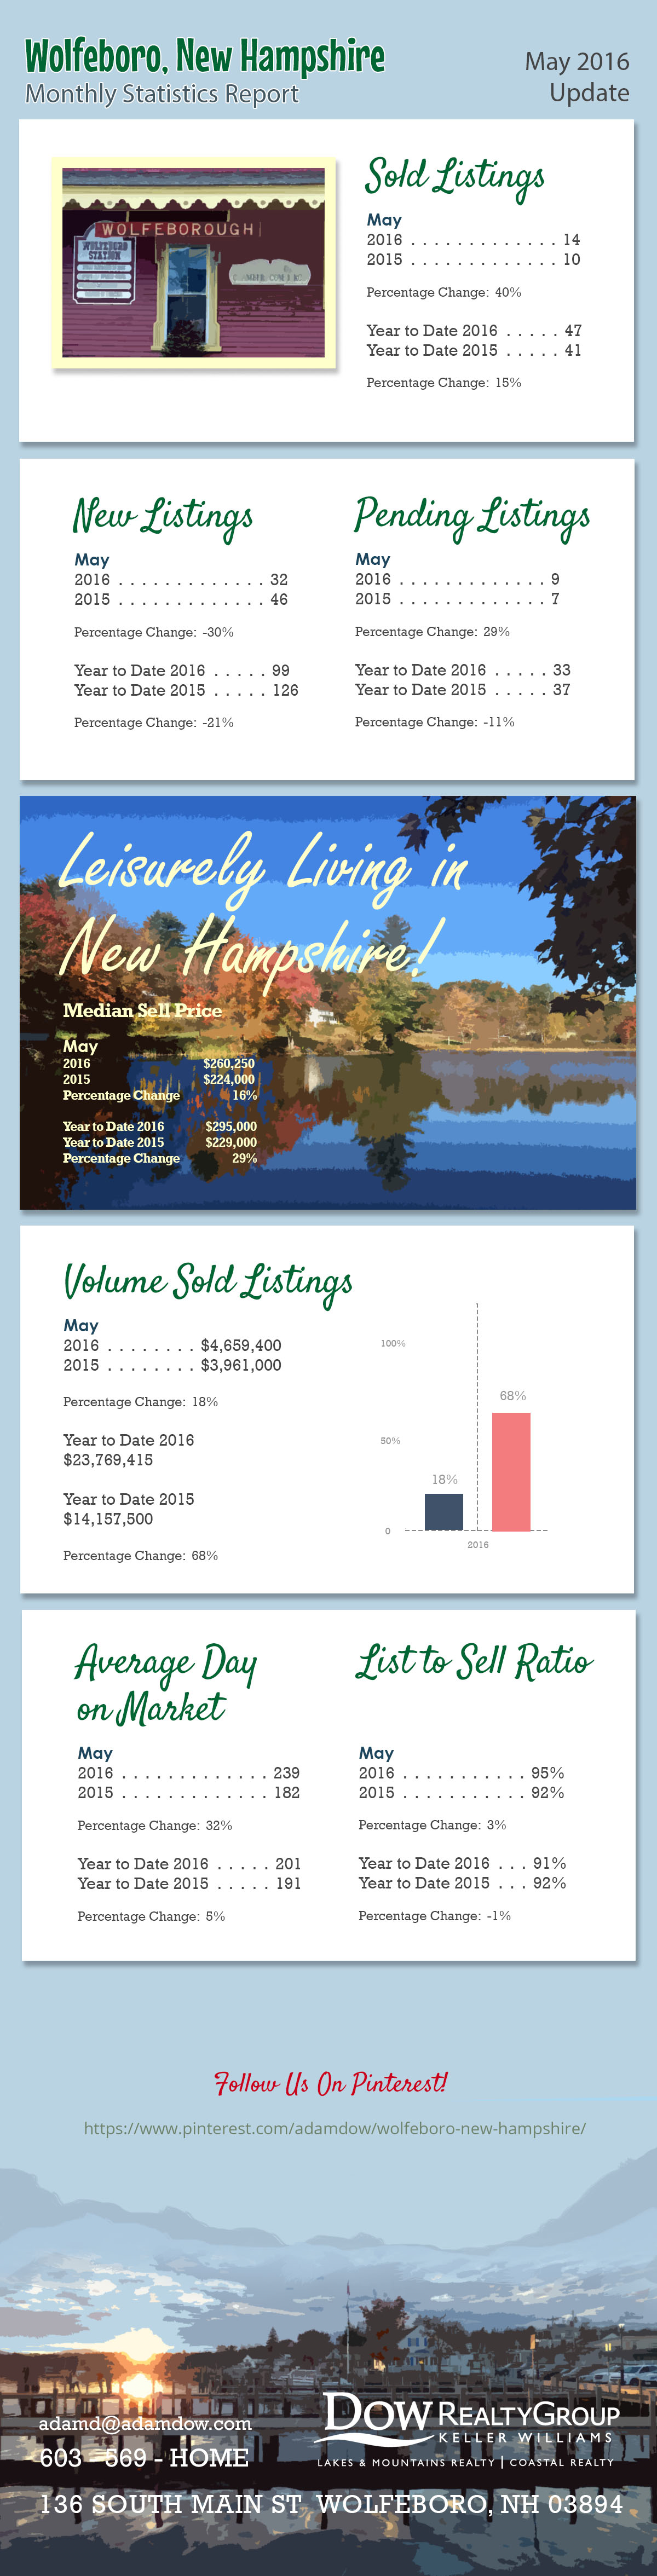
The following is the monthly statistics report for the town of Wolfeboro as of May 2016.
Raw Data from MLS:
| MONTHLY STATISTICS REPORT - 05/01/2016 - 05/31/2016 | ||||
| WOLFEBORO | ||||
| Northern New England Real Estate Network - Compiled on June 13, 2016 | ||||
| Change from | Change from | |||
| 05/01/2016 - 05/31/2016 | 03/31/2016 - 04/30/2016 | 05/01/2015 - 05/31/2015 | 05/01/2015 - 05/31/2015 to | |
| 05/01/2016 - 05/31/2016 | ||||
| Res/Condo/Mfd/Mobile | ||||
| New Listings | 32 | 52.38% | 46 | -30.43% |
| Sold Listings | 14 | 75% | 10 | 40% |
| Pending Listings | 9 | 28.57% | 7 | 28.57% |
| Vol. Sold Listings | $4,659,400.00 | -45.62% | $3,961,000.00 | 17.63% |
| Avg. Sell Price | $332,814.29 | -68.92% | $396,100.00 | -15.97% |
| Median List Price | $269,900.00 | -24.48% | $234,450.00 | 15.12% |
| Median Sell Price | $260,250.00 | -21.13% | $224,000.00 | 16.18% |
| List to Sell Ratio | 94.87% | 3.95% | 92.18% | 2.92% |
| Avg. Day on Market | 239 | 22.25% | 182 | 31.60% |
| YTD | YTD | 2015 - 2016 | ||
| 2016 | 2015 | YTD | ||
| 99 | 126 | -21.42% | ||
| 47 | 41 | 14.63% | ||
| 33 | 37 | -10.81% | ||
| $23,769,415.00 | $14,157,500.00 | 67.89% | ||
| $505,732.23 | $345,304.88 | 46.45% | ||
| $338,000.00 | $249,000.00 | 35.74% | ||
| $295,000.00 | $229,000.00 | 28.82% | ||
| 91.20% | 91.57% | -0.40% | ||
| 201 | 191 | 5.00% | ||
Listing link to the properties in Wolfeboro:
http://www.adamdow.com/wolfeboro/just-listed-wolfeboro/
Pinterest link:
.webp)


Social Media Links